Flooding: Technical Watershed Studies
The methodology described below was used to develop an initial prioritized list of watersheds based on flood exposure for further analysis in Phase 2 of the Comprehensive Flood Management Plan. The flood-exposure based approach began by considering the following attributes:
| Attribute | Measure of Attribute within Mapped Flood Hazard Areas |
|---|---|
| Non-Residential Buildings | Number of non-residential buildings categorized as non-residential from property land use designations |
| Residential Buildings | Number of residential buildings categorized as residential from property land use designations |
| Socially Vulnerable Areas | Total flooded area within defined social vulnerability areas Social Vulnerable Areas (CDC SVI greater than 0.5) |
| Total Impervious Area | Total flooded impervious area for each modeling output |
| Critical Facilities and Infrastructure | Number of critical facilities and infrastructure |
| Environmentally Sensitive Areas | Total flooded area within the United States Fish & Wildlife Services (USFWS) National Wetlands Inventory (NWI) area |
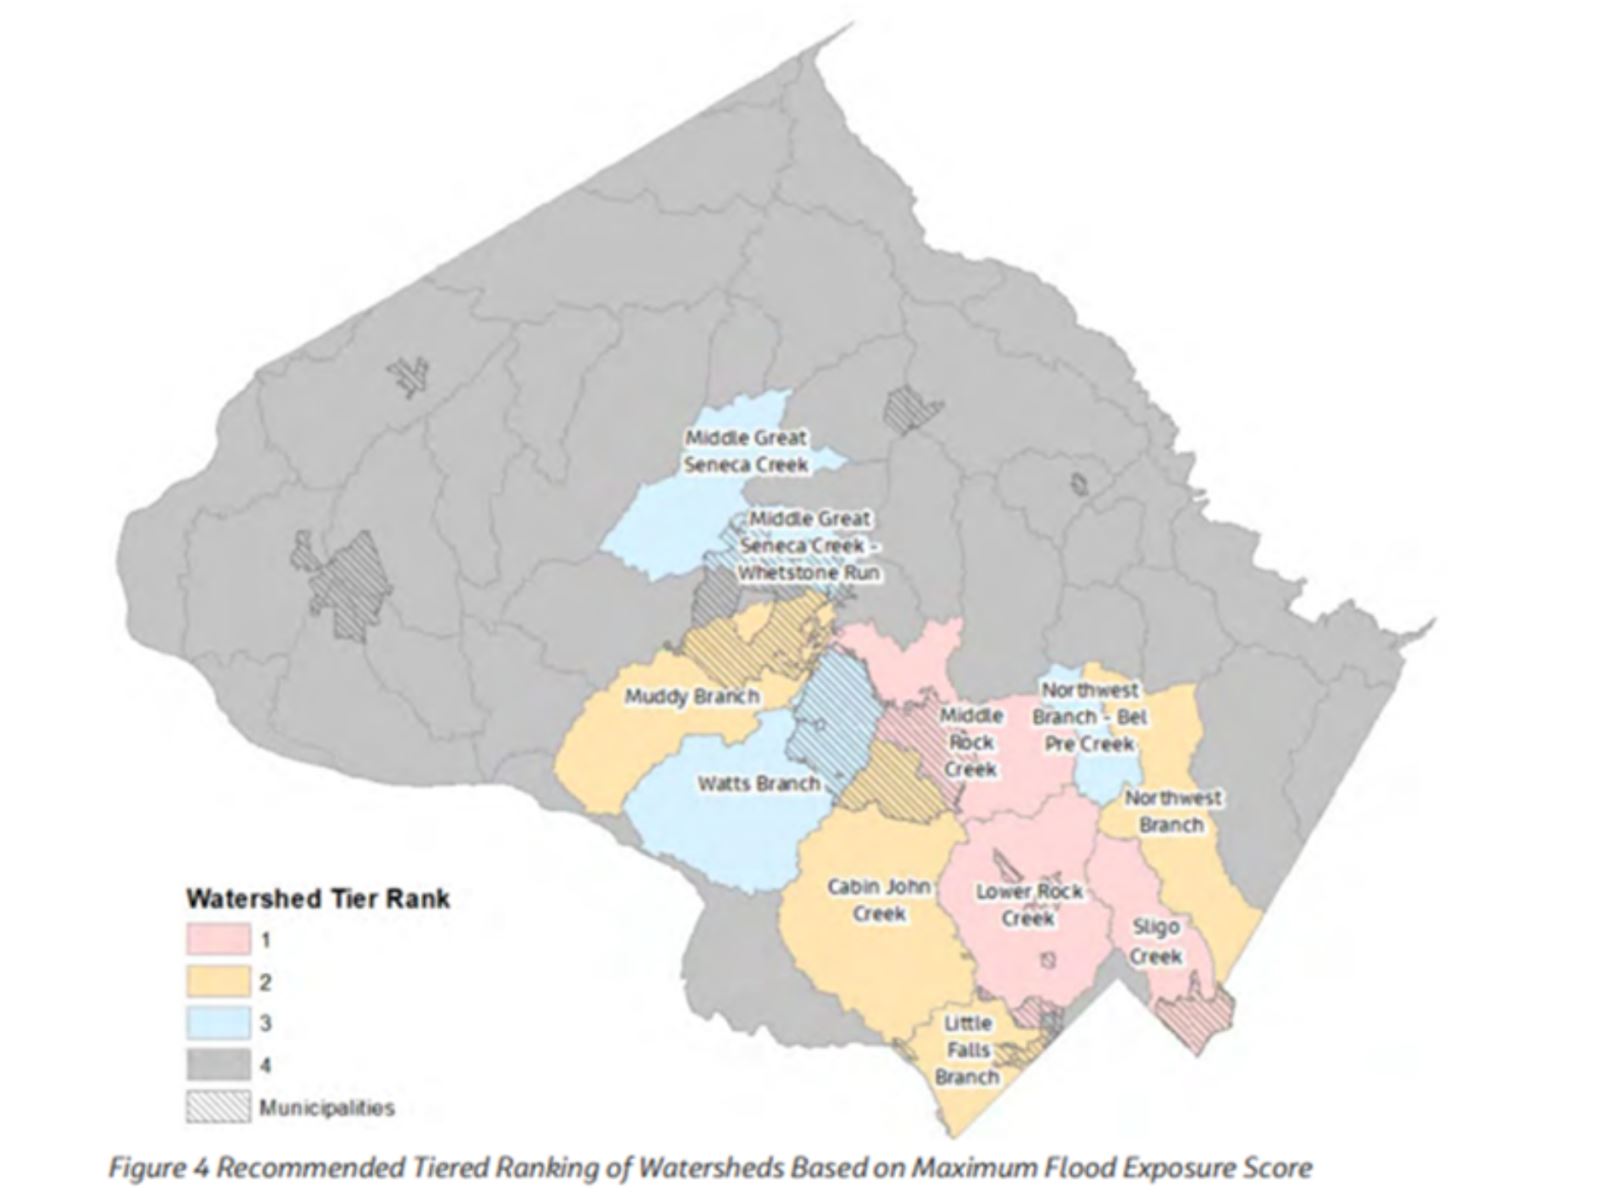
These attributes were measured using available flood hazard information. Scores were compiled for each attribute and flood exposure layer and scores were combined using a multi-attribute weighting. Watersheds were grouped into tiers to represent their priority for detailed study according to their total flood exposure score. The watersheds with the highest scores are listed and mapped below:
| Tier | Watershed | Area (Acres) | Estimated Population | Estimated Population in Areas with SVI > 0.5 a | % of Population in Areas with SVI > 0.5 |
|---|---|---|---|---|---|
| 1 | Middle Rock Creek | 10,780 | 77,117 | 37,756 | 49.0% |
| Lower Rock Creek | 12,005 | 113,565 | 26,610 | 23.4% | |
| Sligo Creek | 6,156 | 68,817 | 25,792 | 37.5% | |
| 2 | Cabin John Creek | 16,303 | 73,477 | 5,275 | 7.2% |
| Little Falls Branch | 4,821 | 43,454 | 0 | 0.0% | |
| Northwest Branch | 9,706 | 58,495 | 21,078 | 36.0% | |
| Muddy Branch | 12,531 | 57,984 | 8,526 | 14.7% | |
| 3 | Middle Great Seneca Creek | 9,028 | 58,791 | 21,503 | 36.6% |
| Middle Great Seneca Creek – Whetstone Run | 3,049 | 44,518 | 41,154 | 92.4% | |
| Northwest Branch – Bel Pre Creek | 2,866 | 27,935 | 15,919 | 57.0% | |
| Watts Branch | 14,231 | 45,036 | 1,560 | 3.5% | |
| Total | 101,476 | 669,189 | 205,173 | 30.7% | |
Notes: a. SVI = CDC Social Vulnerability Index. The CDC SVI compiles various socioeconomic indicators at the Census tract level into a single index value used for the flooding exposure assessment.
Watershed Maps
The results of this assessment provide an understanding of potential flood exposure using available information. Detailed vulnerability assessments are anticipated to be performed as part of Phase 2 watershed risk assessment.
Tiered Ranking of Watersheds by Flood Exposure
Currently, detailed watershed studies for Tier 1 watersheds are scheduled to be complete by the end of calendar year 2025. Studies for all Tier 1-3 watersheds are anticipated by the end of 2026.
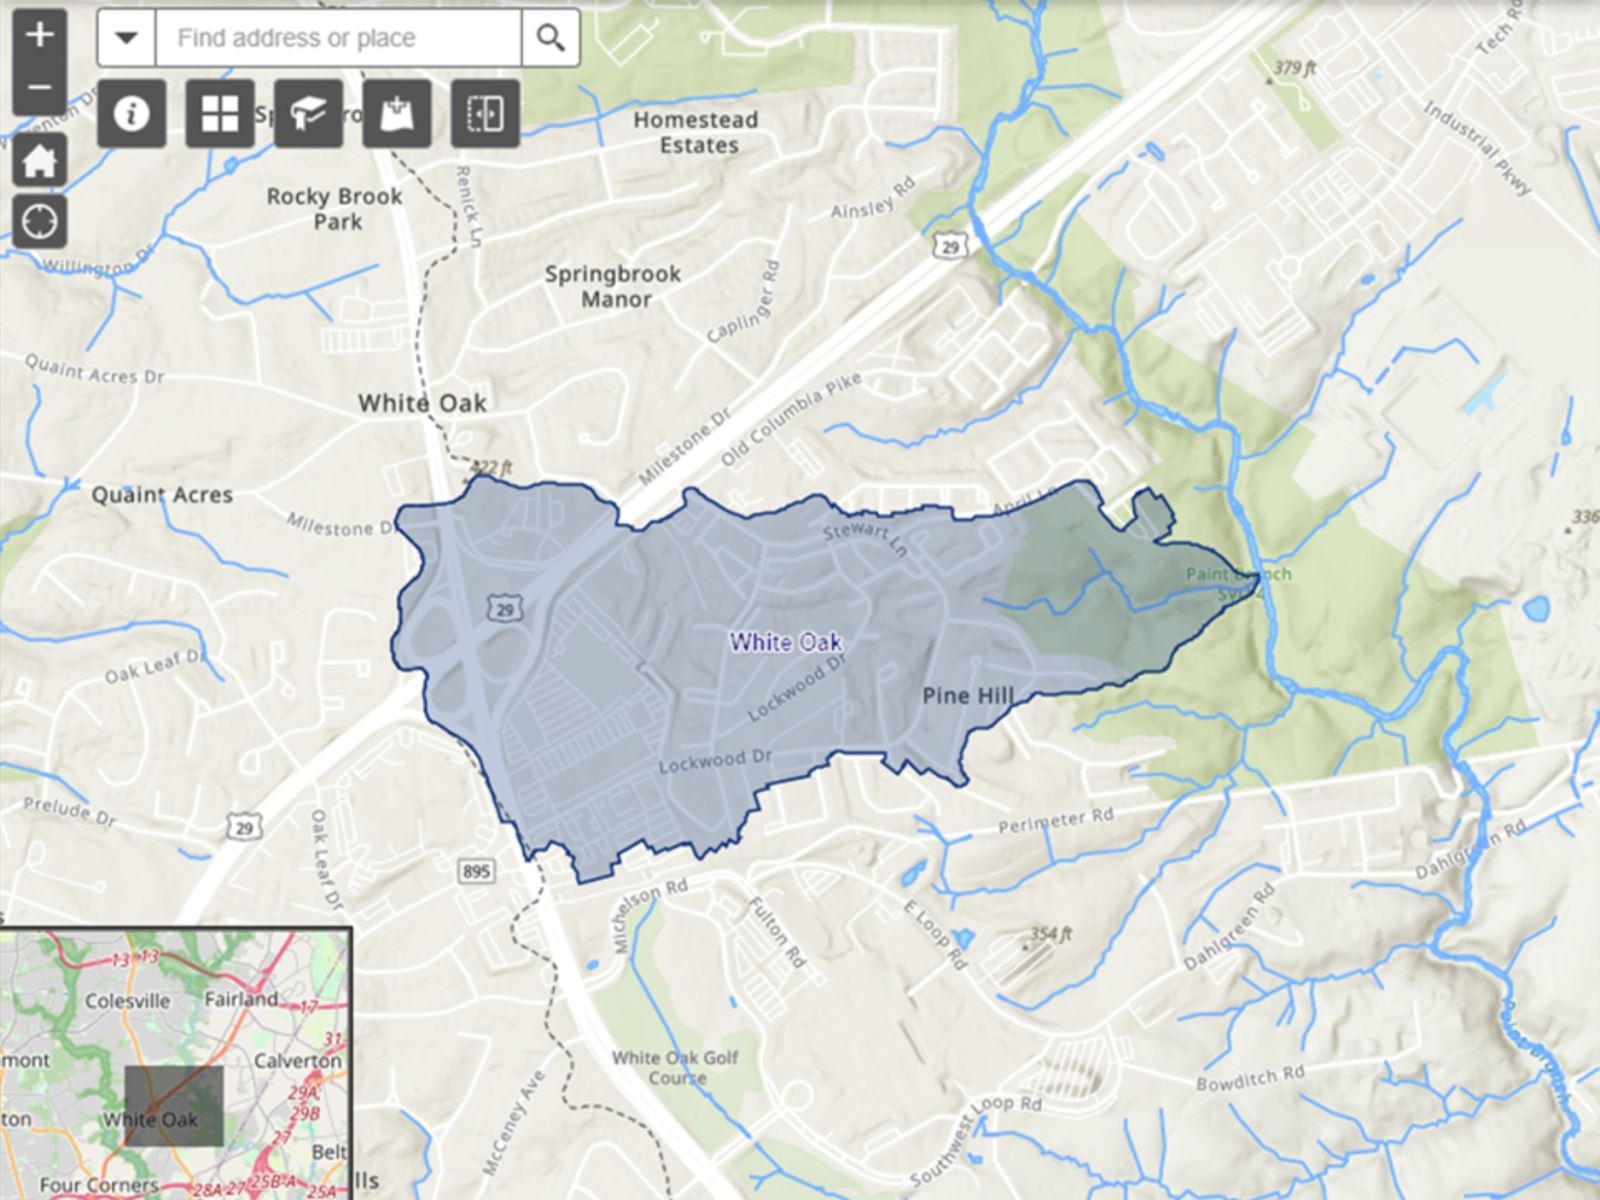
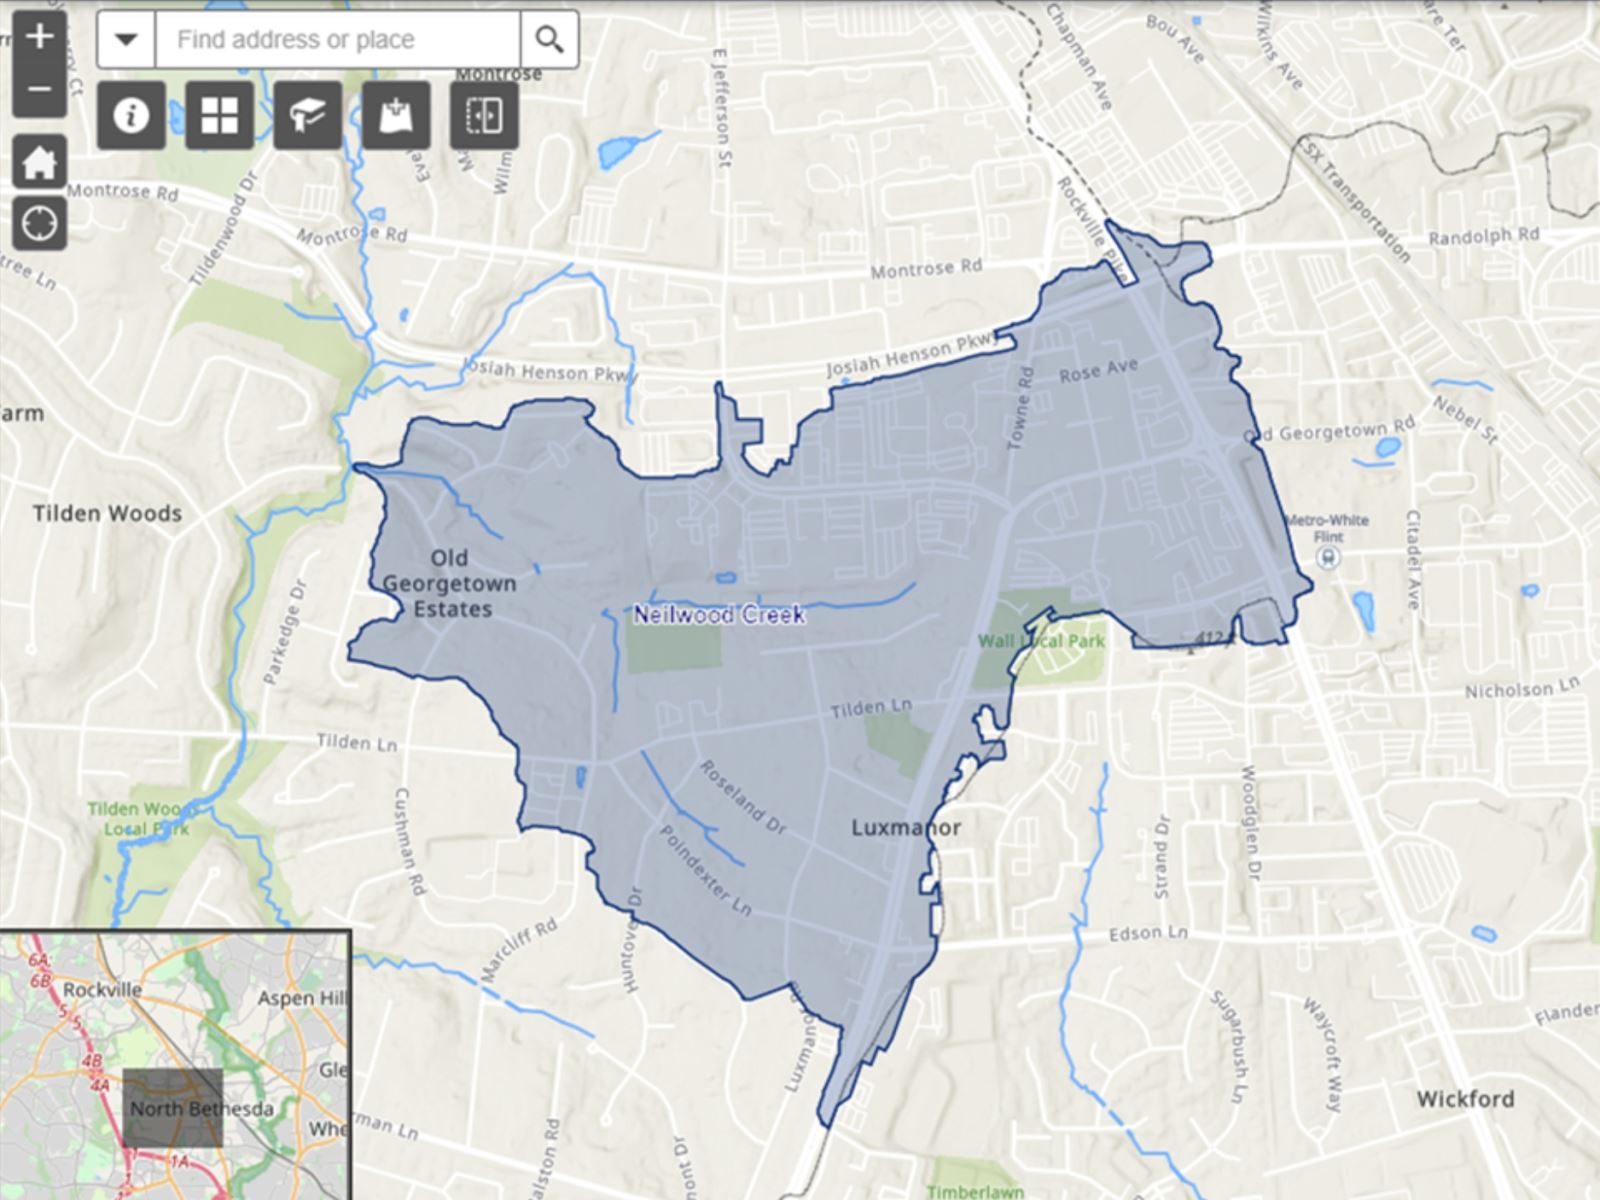
The U.S. Army Corps of Engineers (USACE) is completing studies for two smaller subwatersheds located within Paint Branch Watershed (White Oak subwatershed) and Cabin John Watershed (Neilwood Creek subwatershed). These subwatersheds were selected based on a number of factors including:
- EJSCREEN Demographic Index (DI) Percentile
- 30 acre DA line near residential dwellings
- Flood Factor inundation mapping
- Housing type
- Resident complaints
Models for these two watersheds are expected in early 2025.
Neilwood Creek Subwatershed
White Oak Subwatershed