See more in Data
COVID-19 Wastewater Surveillance in Montgomery County
Effective August 27, 2024, we are pausing the data updates for wastewater surveillance on this page.
Montgomery County's Department of Health and Human Services (DHHS) is collaborating with the University of Maryland's Department of Civil and Environmental Engineering (UMD) and Inspection Experts, Inc. (IEI) to implement wastewater surveillance of COVID-19 in Montgomery County, leveraging experiences from the Maryland’s Sewer Sentinel Initiative. The project’s goal is to collect data to observe trends in SARS-Cov-2 concentrations over time.
Wastewater testing of SARS-CoV-2 (COVID-19) provides supplementary information on COVID-19 prevalence in the communities. SARS-CoV-2 can be shed in feces by infected individuals. This makes it possible to track COVID-19 through sewage testing, even for people without symptoms.
Wastewater surveillance provides an early indication of COVID-19 spread in communities. When used along with other surveillance data, this wastewater information helps public health officials take action quickly.
CDC launched the National Wastewater Surveillance System (NWSS) in September 2020 in response to the COVID-19 pandemic. Wastewater samples have been collected across the country to track the presence of SARS-CoV-2.
In Maryland, the Department of the Environment (MDE) and the Department of Health (MDH) conducted the Sewer Sentinel Initiative to monitor the concentration of SARS-CoV-2 in five wastewater treatment plants across the state. The pooled sampling approach was used to support Maryland’s response to surges in vulnerable populations and provide useful information.
Water Sampling Protocol and Methods of Analysis
Water samples are collected by IEI weekly and sent to UMD labs for analysis. Data are then sent to DHHS.
Selection of wastewater sample collection sites was based on these criteria:
- disease burden of COVID-19,
- vulnerable population/communities,
- population density,
- areas of healthcare utilization, and
- site characteristics (i.e., wastewater treatment plant/pumping stations/manhole, industrial effluent/hospital and nursing homes, readily available flow rate data, etc.)
Protocols for water sample collection and analysis are described in Sampling Protocol - IEI (PDF) and UMD - Analysis protocol and data report (PDF)
See more information on wastewater surveillance data reporting and analytics from the CDC.
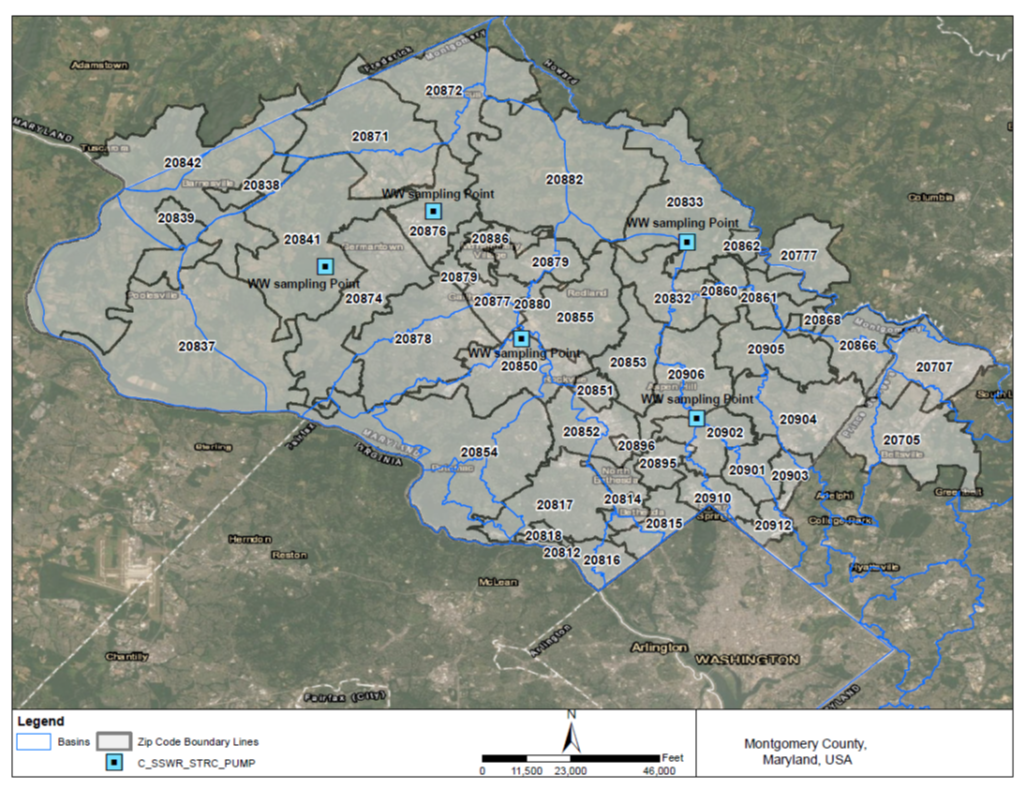
Water Sample Collection Sites
Samples are obtained from each site twice per week.
See methods and criteria used for final site selection in the Site Visit and Final Selection Report (PDF).
| Site name | Site address | Sewer network ZIP codes |
|---|---|---|
| Reddy Branch | 2611 Brighton Dam Rd Brookville, MD 20833 |
20832, 20833 |
| Arcola | 22001 Henderson Avenue Wheaton, MD 20855 |
20901, 20902,20903, 20906, 20910, 20912, 20832 |
| King Farm | 315 Pure Spring Cresent Rockville, MD 20850 |
20850, 20854 |
| Hoyles Mill | 15001 Hoyles Mill Rd Boyds, MD 20841 |
20841, 20874 |
| Wexford | 21225 Seneca Crossing Dr Germantown, MD 20876 |
20874, 20876, 20886 |
Data
Data updated August 27, 2024.
Learn more about how to interpret the graphs (PDF) and how to interpret the heatmap (PDF).
COVID-19
Figure 1. Wastewater Surveillance (Average) and Clinical Data on COVID-19, Montgomery County, MD
Figure 1 shows the daily average and 10-day rolling average of COVID-19 detected in wastewater samples, as well as clinical COVID-19 ED visit data, from October 17, 2022 to the present. The 10-day rolling average of COVID-19 wastewater data shows increased activity from October 2022 until January 2023. Increased activity is observed in early September 2023 and early December 2023 with periods of low levels in between. Clinical COVID-19 ED visit data largely show similar overall trends to what is observed in wastewater data.
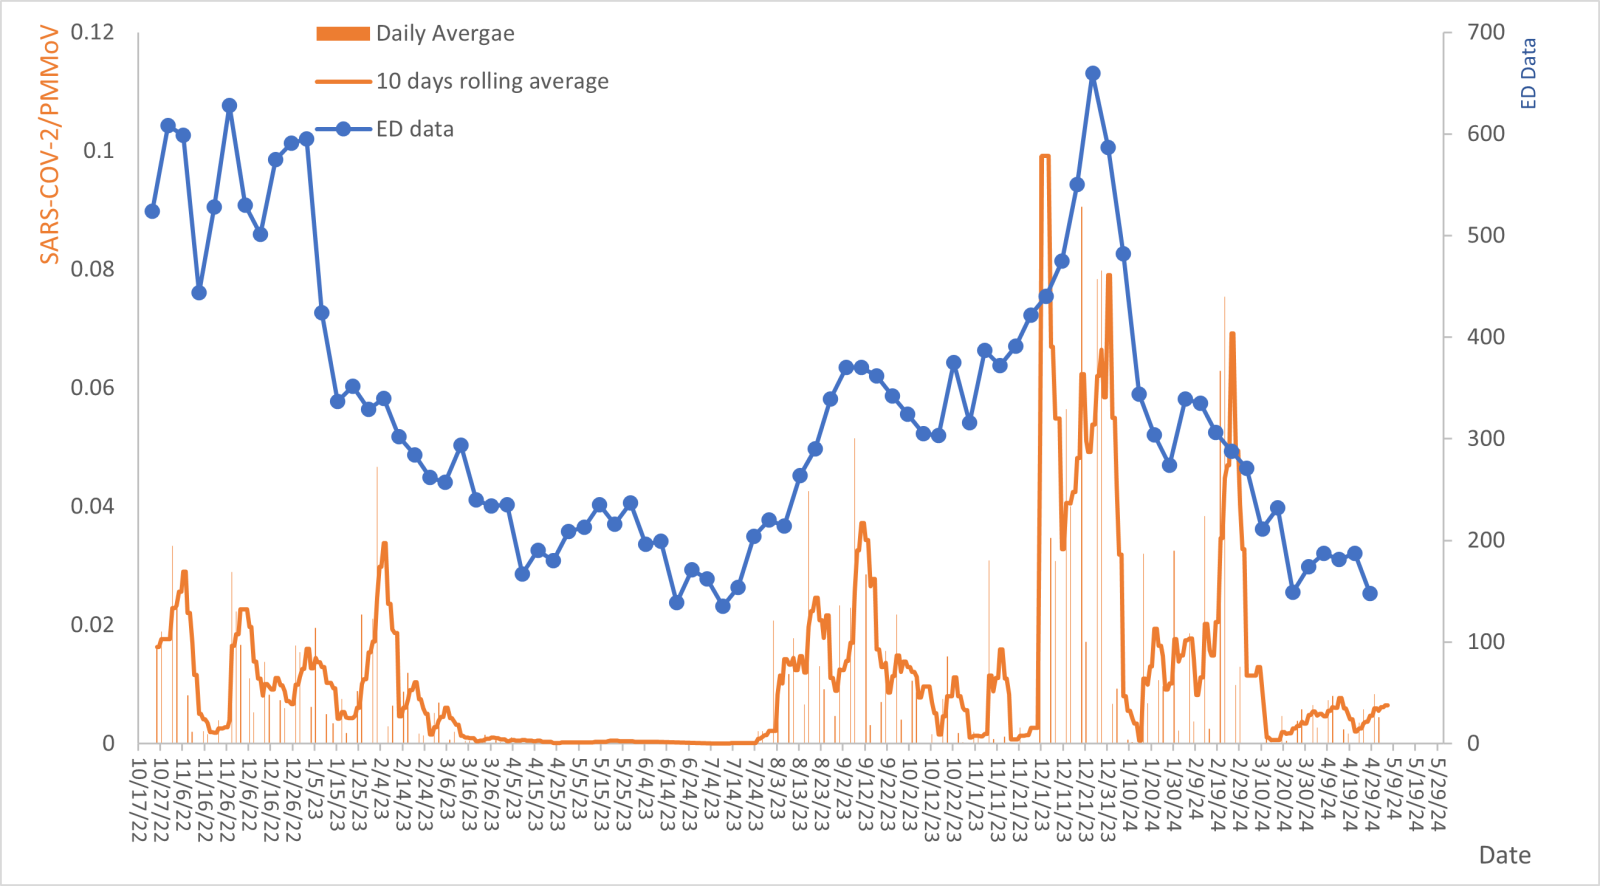
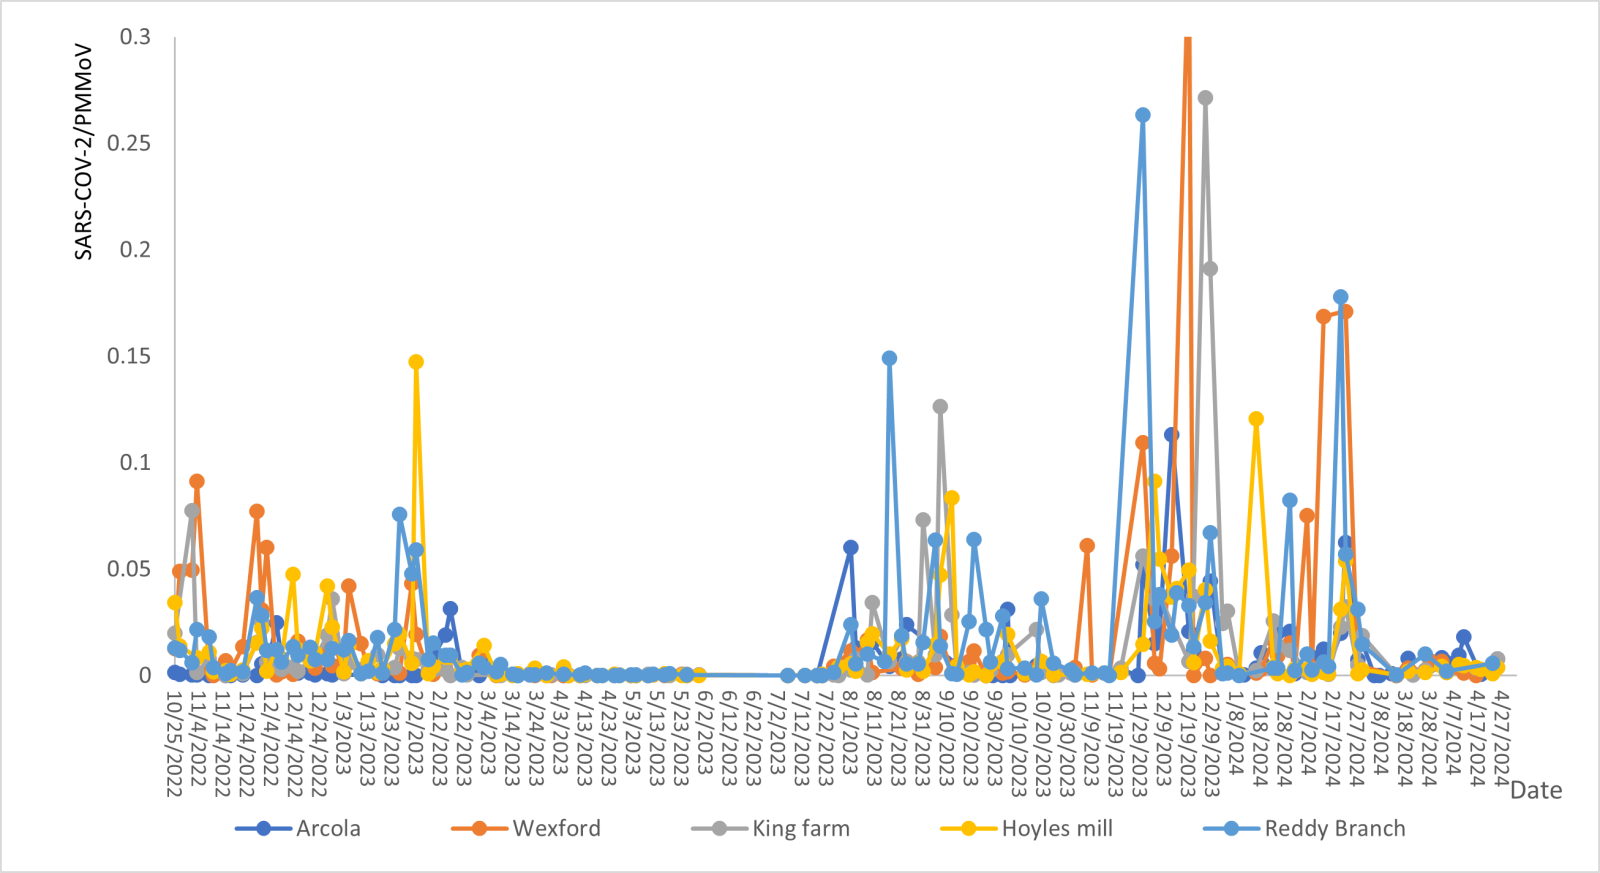
Figure 2. Wastewater Surveillance by Site on COVID-19, Montgomery County, MD
Figure 2 shows levels of COVID-19 detected in wastewater from October 25, 2022 to the present by collection site. The levels vary greatly over time among sites. At the beginning, the sites of Wexford and King Farm have higher levels, until February 2023 when higher levels are observed at Reddy Branch and Hoyles Mill. An increasing trend is observed at King Farm as of September 2023. The level is not detectable at Hoyles Mill. By December 2023, high levels are detected at Wexford. Arcola has a new location but is not included in the County average.
Hepatitis A
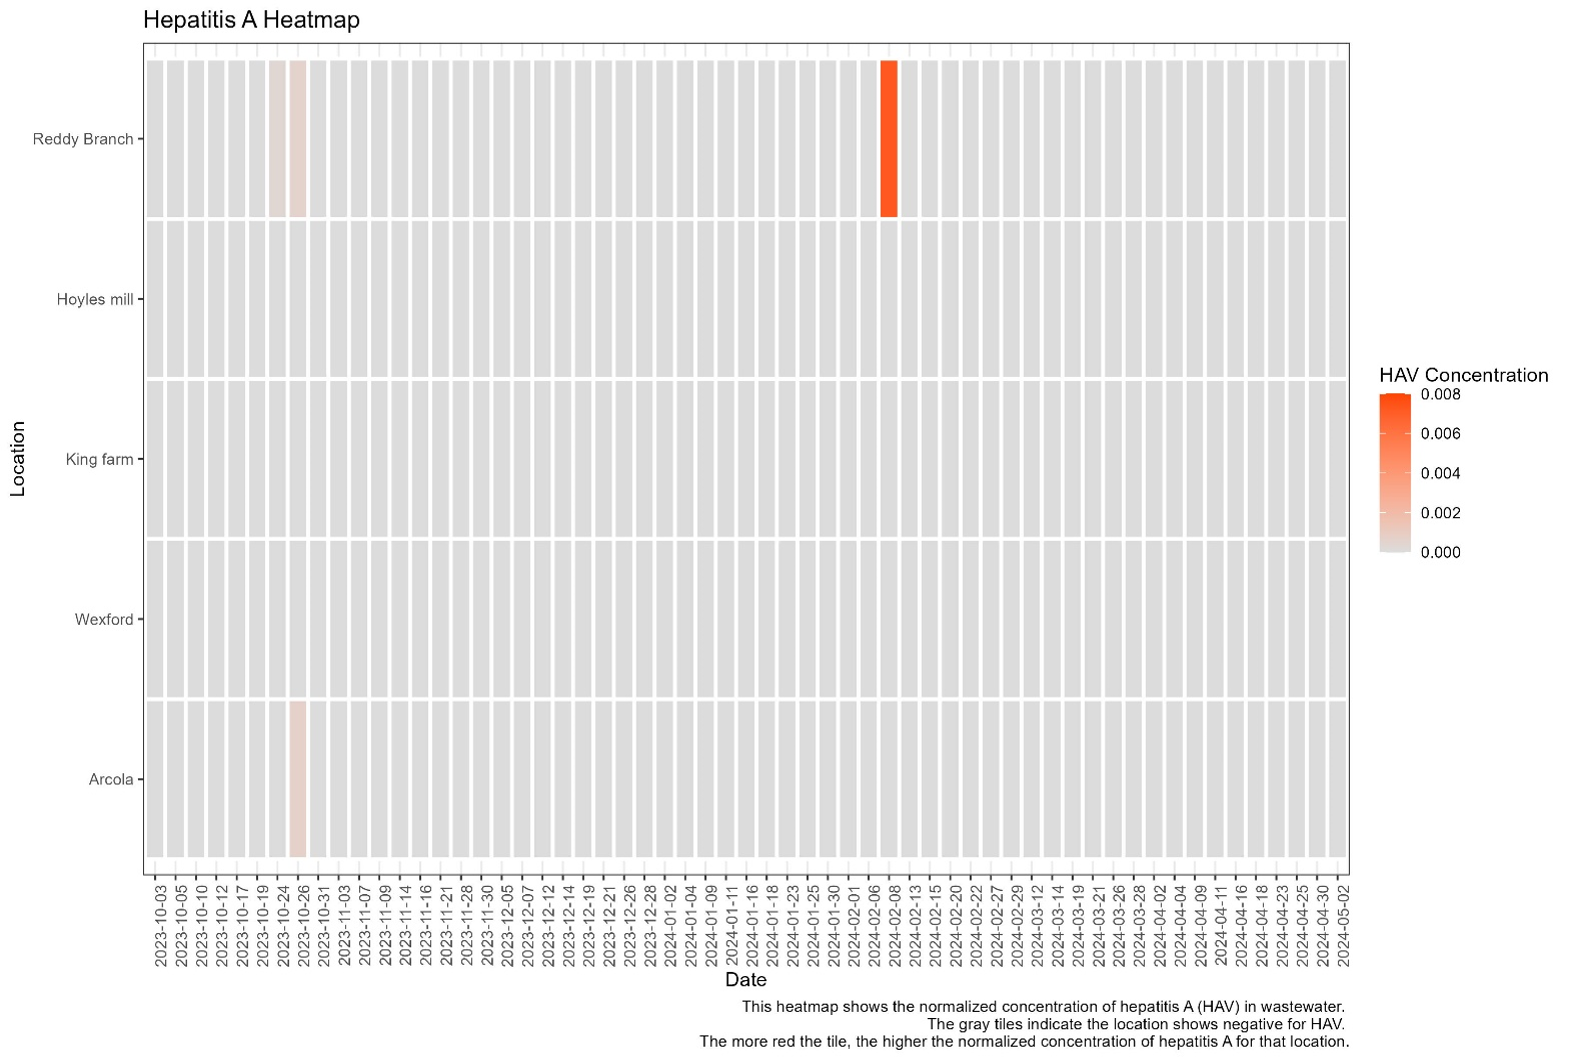
Figure 3. Hepatitis A Heatmap
Figure 3 shows a heatmap of the normalized concentration of hepatitis A (HAV) in wastewater. Gray tiles indicate the location was negative for HAV. The more red the tile, the higher the normalized concentration of hepatitis A for that location. Only Reddy Branch and Arcola show some concentration occurring at the end of October 2023. By early February 2024, high levels of concentration are detected at Reddy Branch.
Influenza
Figure 4. Wastewater Surveillance (Average) and Clinical Data on Influenza, Montgomery County, MD
Figure 4 shows the daily average and 10-day rolling average of Influenza detected in wastewater samples, as well as clinical Influenza ER visit data, from October 1, 2023 to the present. The 10-day rolling average of Influenza wastewater data shows increased activity from November through the beginning of December 2023. The influenza concentration in wastewater decreases in late Feburary 2024 and becomes undetectable by late March 2024. Clinical Influenza ER visit data largely show similar overall trends to what is observed in wastewater data.
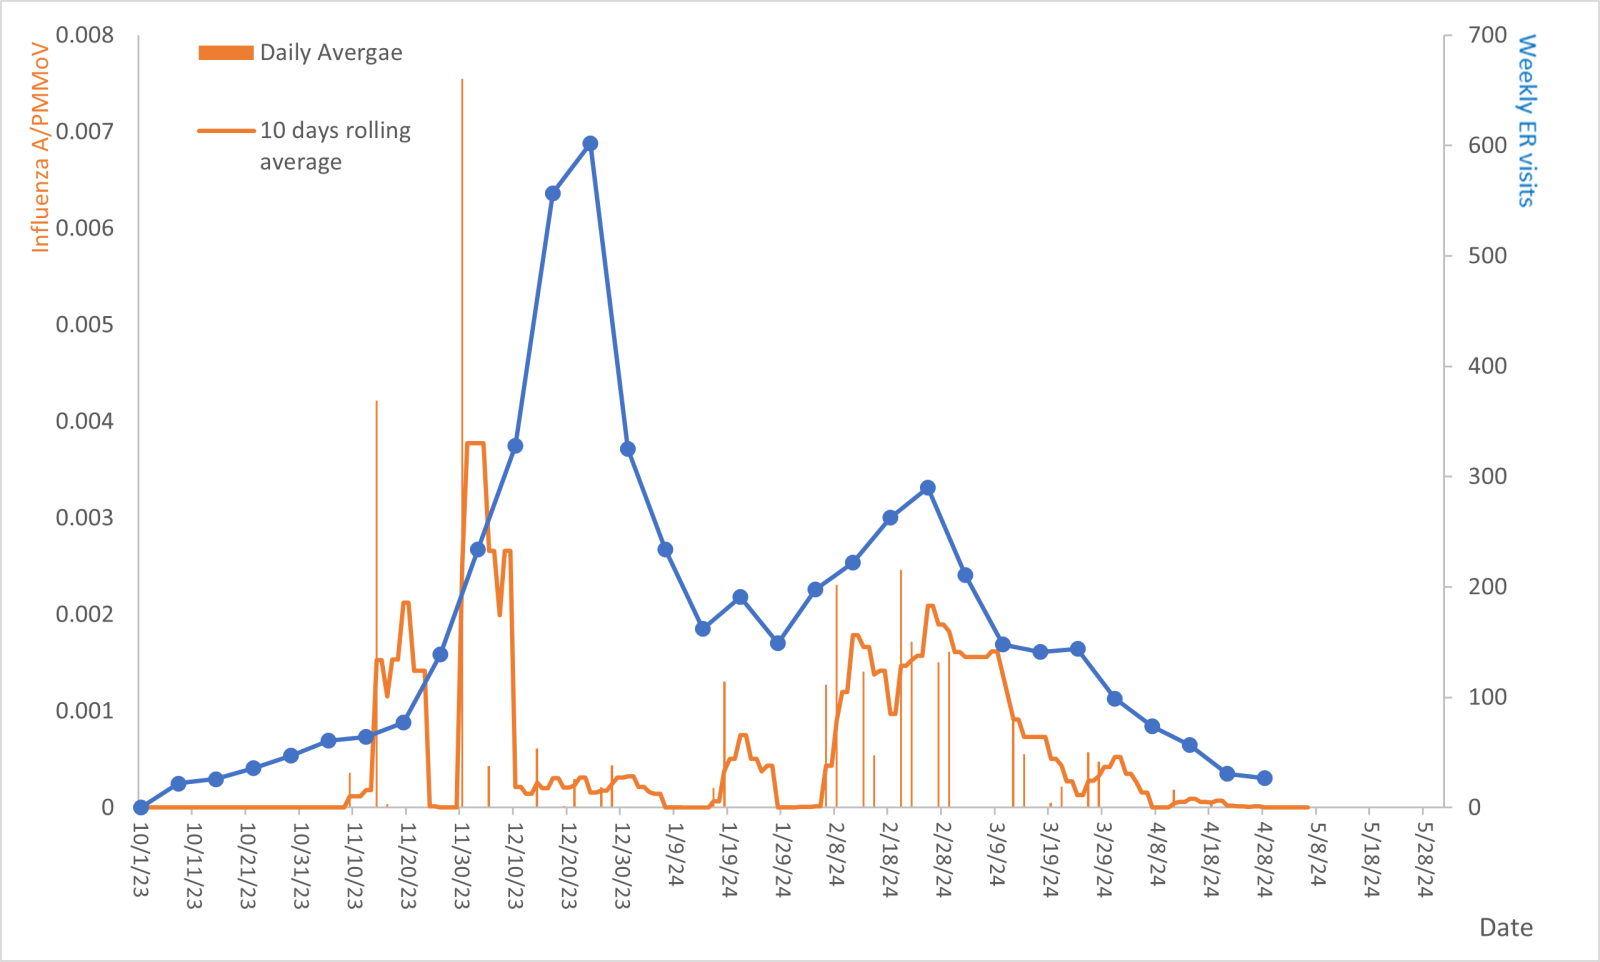
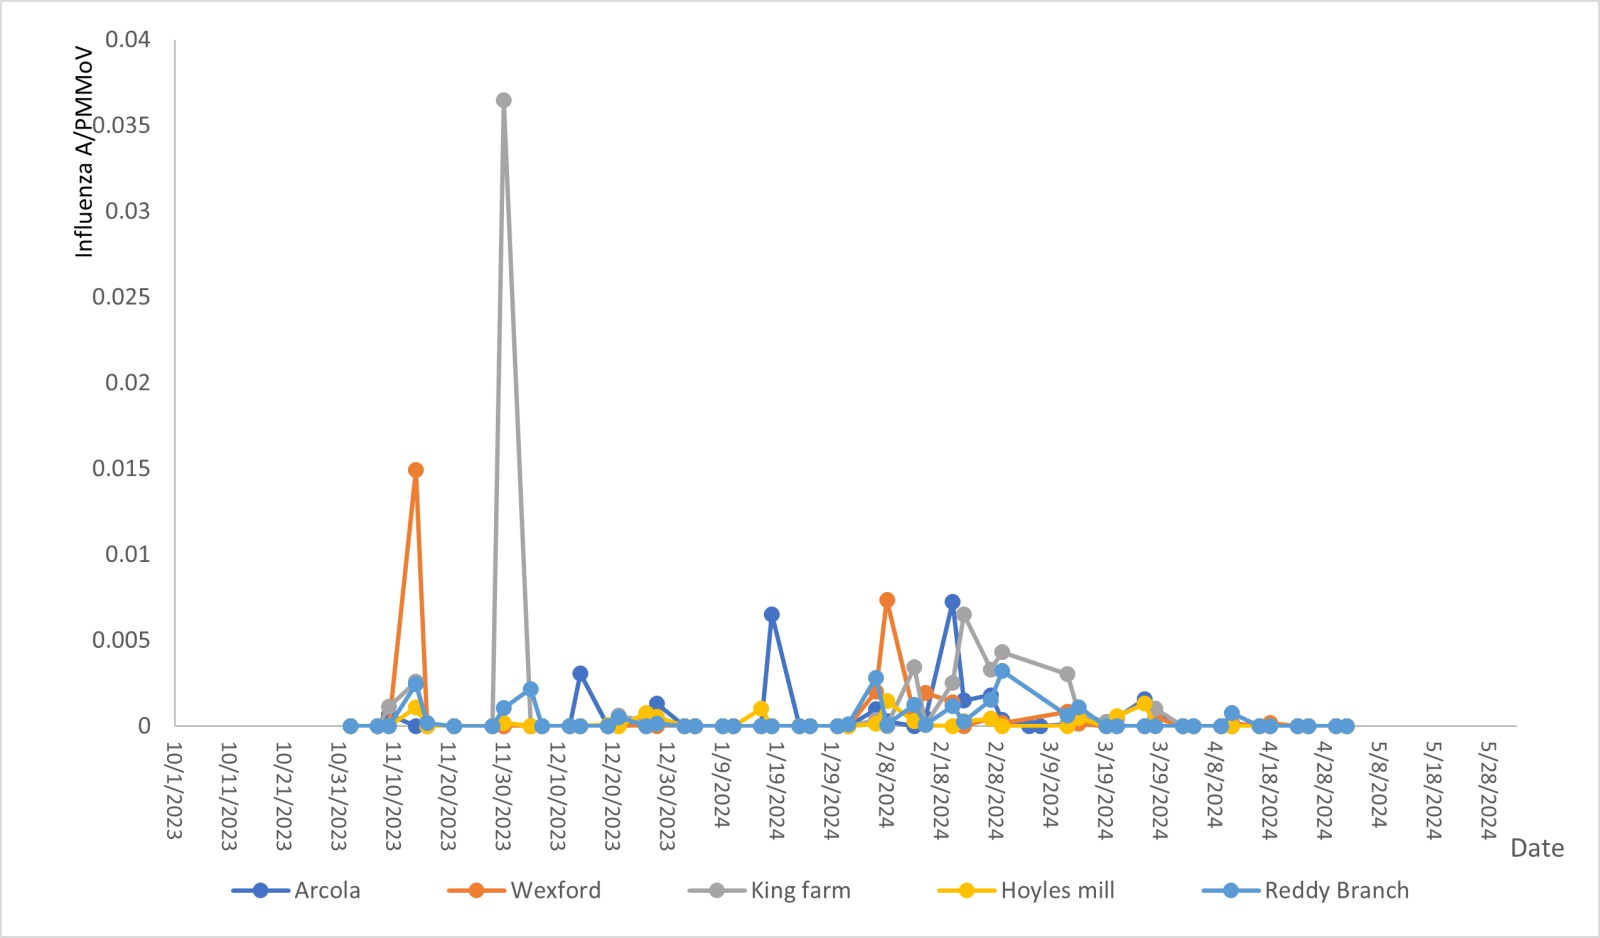
Figure 5. Wastewater Surveillance by Site on Influenza, Montgomery County, MD
Figure 5 shows levels of Influenza detected in wastewater from October 2023 to the present by collection site. The levels vary over time among sites. Notable increases among sites are observed at Wexford and King Farm, occurring during November 2023. In late March 2024, Influenza concentration in wastewater decreased to below the detection limit.
Opioids
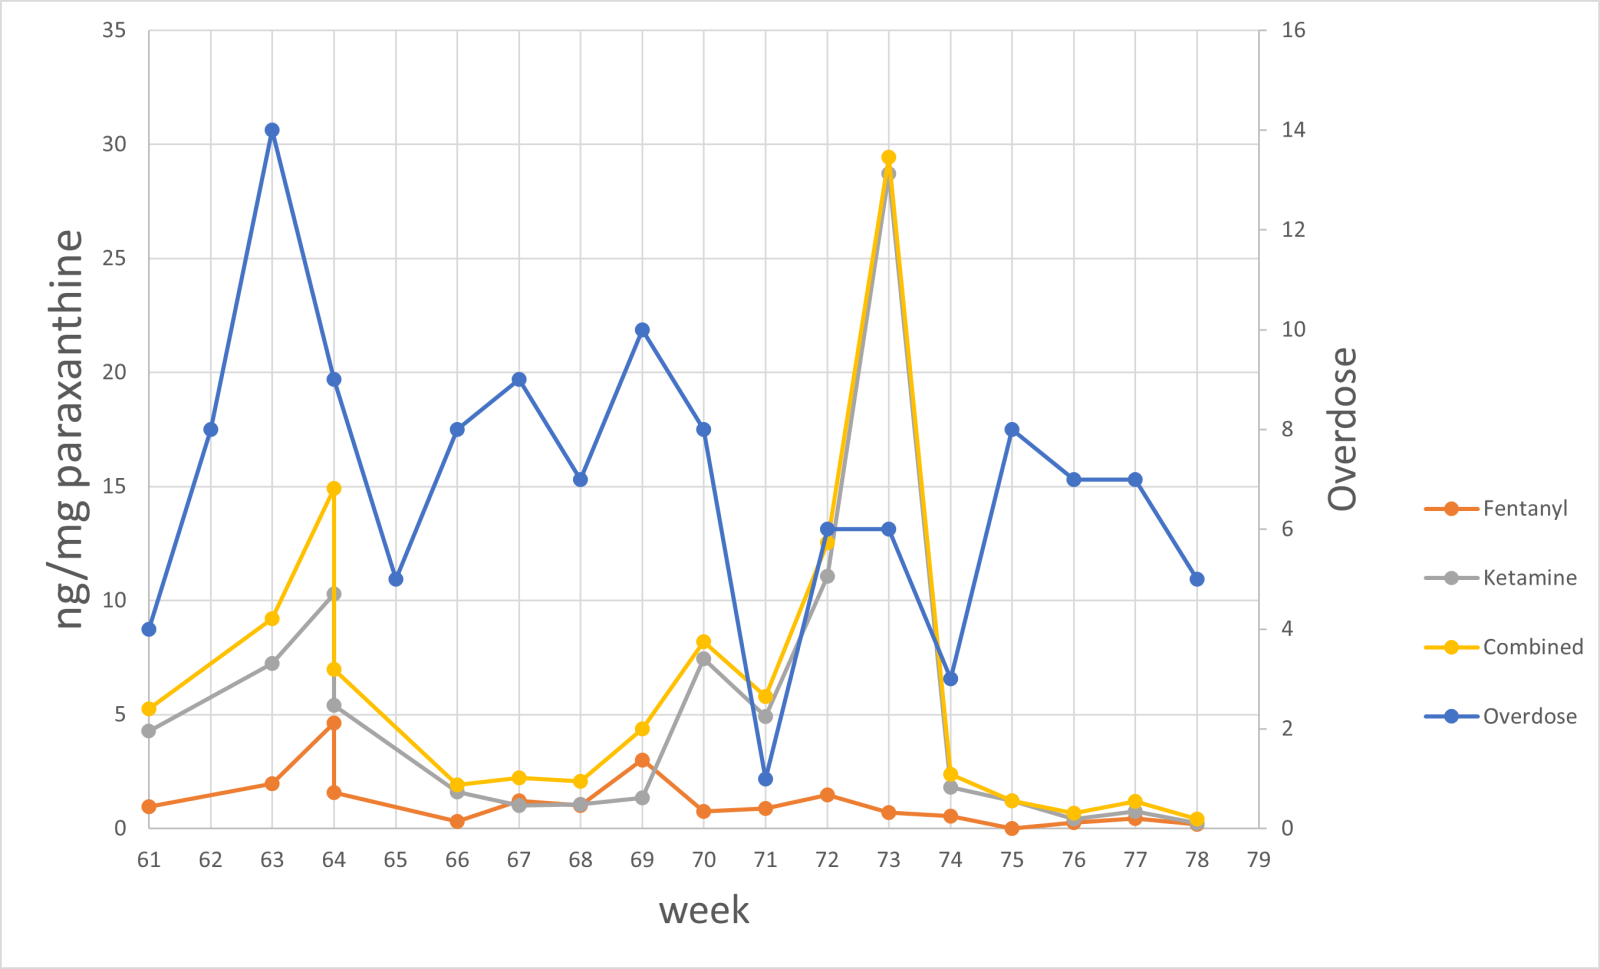
Figure 6. Wastewater Surveillance (Average) and Clinical Data on Opioids, Montgomery County, MD
Figure 6 shows the weekly rolling averages and combination of opioids detected in wastewater samples, as well as clinical opioids overdose ER visit data, from February 19, 2024 to the present. The opioids detected in the wastewater and the overdose ER visits fluctuate weekly. Clinical opioids overdose ER visit data largely show similar overall trends to what is observed in wastewater data.