Climate Action Progress
Greenhouse Gas (GHG) Emissions Trends
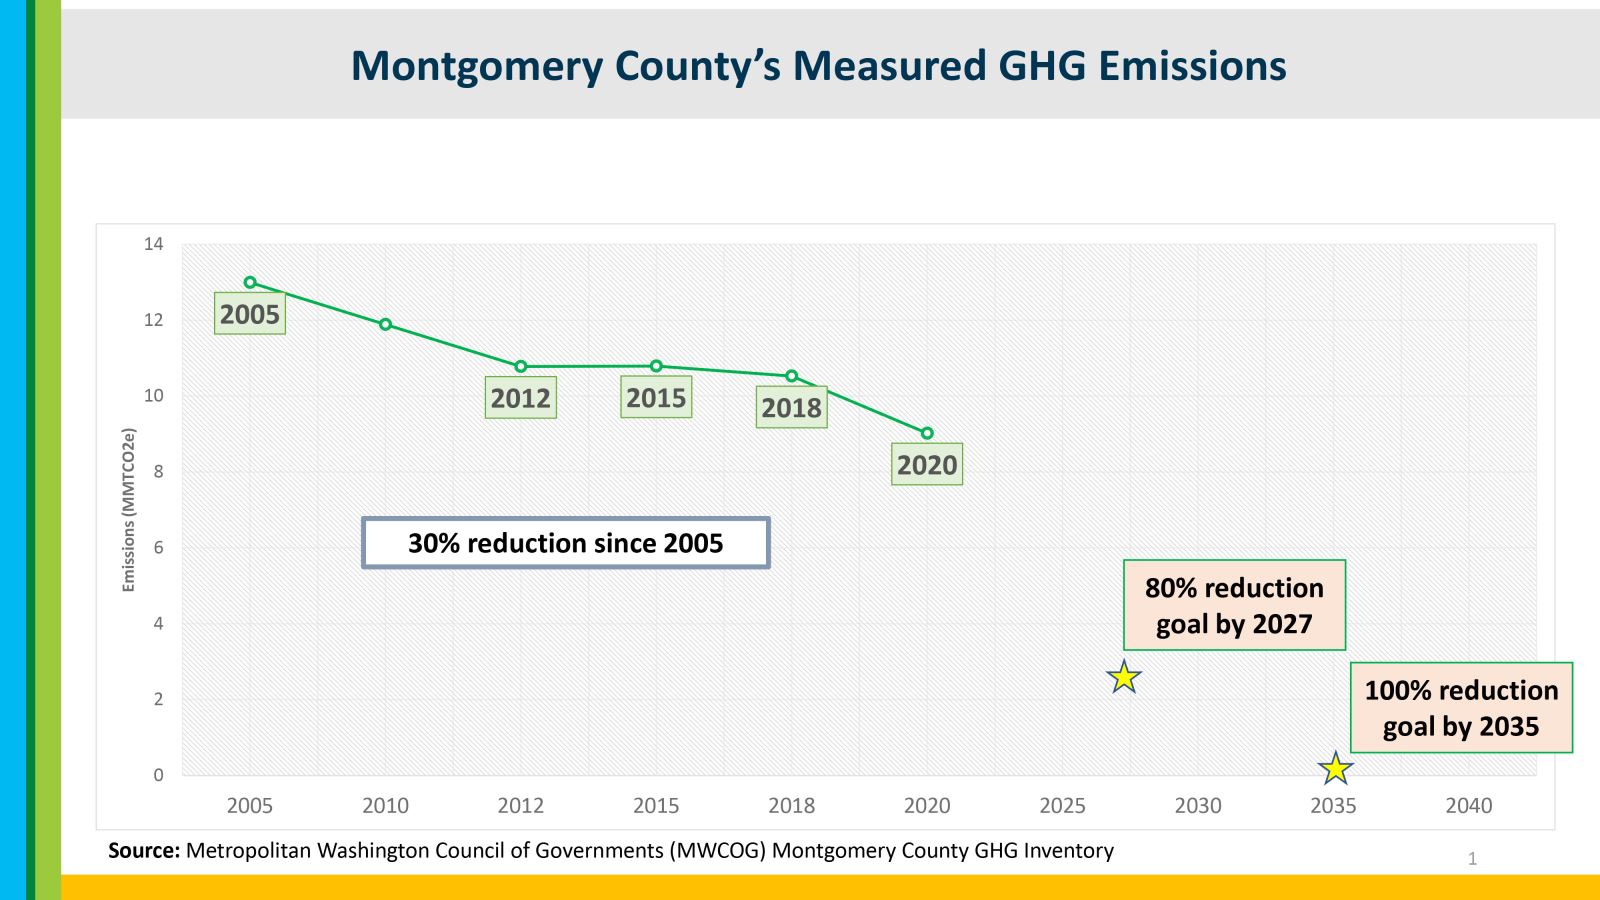
The Metropolitan Washington Council of Governments (MWCOG) conducts GHG emission inventories for its member jurisdictions, including Montgomery County. Inventories have been conducted for 2005, 2012, 2015, 2018, and 2020. These inventories cover emissions from the Montgomery County community, including the County government.
Between 2005 and 2020, Montgomery County’s measured community wide GHG emissions decreased by 30 percent. In 2020, residential and commercial energy consumption accounted for 49% of measured emissions and transportation-related emissions accounted for 40%.
- GHG Summary Fact Sheet (PDF)
- GHG Inventory Data (Excel) – Spreadsheet with tables and graphs, produced by MWCOG on behalf of Montgomery County in December 2022, that provide data on the 2005, 2012, 2015, 2018, and 2020 GHG emissions inventories.
- GHG Contribution Analysis Tool (Excel) – Graphs, produced by MWCOG, showing the main drivers for emissions and emissions reductions in Montgomery County between 2005 and 2020