
ARCHIVED - Montgomery County COVID-19 Data Tables and Graphs
This page is archived, with data released through May 11, 2023. We no longer update this page.
See our current case data.
- Counts may be different from those reported by Maryland, due to sources of reporting.
- Cases with unknown sex/age are excluded.
- Rates are per 100,000 population.
The information in the case and death count tables is based on the Maryland Department of Health data released on 5/11/2023.
We normally update this page on Fridays. For a daily updates on cases and deaths, see the State of Maryland COVID-19 Data Dashboard.
On this page
- Confirmed Cases by Age and Sex
- Case Rate by Age over Time
- Case Rate by Race/Ethnicity over Time
- Cases by ZIP Code
- Cases by Vaccination Status
- Hospitalizations by Race/Ethnicity over Time
- Hospitalizations by Vaccination Status
- Deaths by Age and Sex
- Deaths by Race/Ethnicity over Time
- Deaths by Vaccination Status
- Deaths by ZIP Code
- Montgomery County Employee Cases
- Montgomery County Employee Vaccination Status
Other COVID-19 Data
- CDC COVID-19 Metrics
- COVID-19 Surveillance Dashboard - including test positivity
- Vaccine Distribution Dashboard
- Wastewater Surveillance
| Age Group | Male | Female | Total | |||
|---|---|---|---|---|---|---|
| Count | Rate per 100K population | Count | Rate per 100K population | Count | Rate | |
| 0-4 years | 6,754 | 20,557.0 | 6,080 | 19,141.8 | 12,805 | 19,861.3 |
| 5-17 years | 18,804 | 20,659.9 | 18,397 | 21,289.9 | 37,199 | 20,966.8 |
| 18-34 years | 27,476 | 25,864.4 | 33,918 | 31,720.1 | 61,394 | 28,801.8 |
| 35-64 years | 44,283 | 21,621.6 | 52,493 | 23,684.1 | 96,776 | 22,693.6 |
| 65+ years | 13,106 | 17,966.2 | 15,358 | 15,981.9 | 28,464 | 16,838.2 |
| Total: all ages | 110,421 | 21,742.8 | 126,246 | 23,256.7 | 236,667 | 22,525.0 |
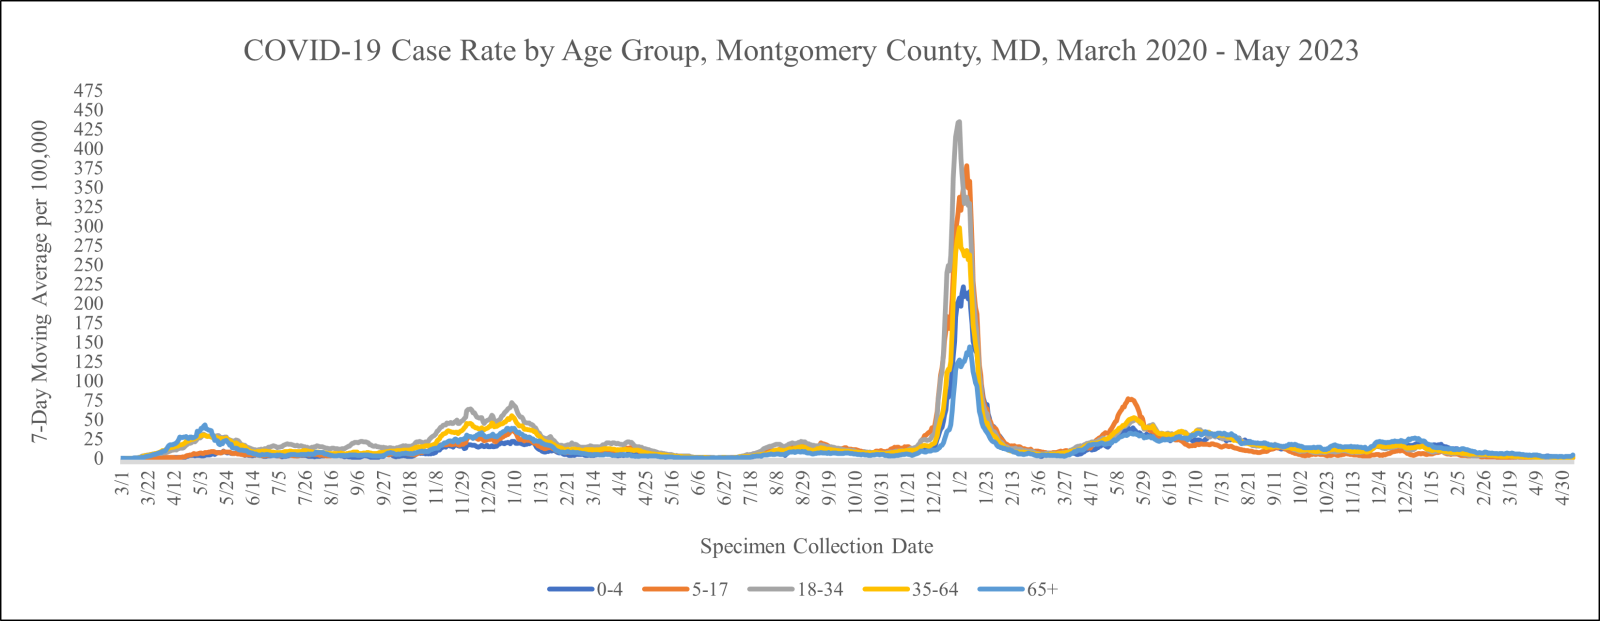
Case Rate by Age over Time
Download data for Confirmed Cases by Age and Month (CSV)
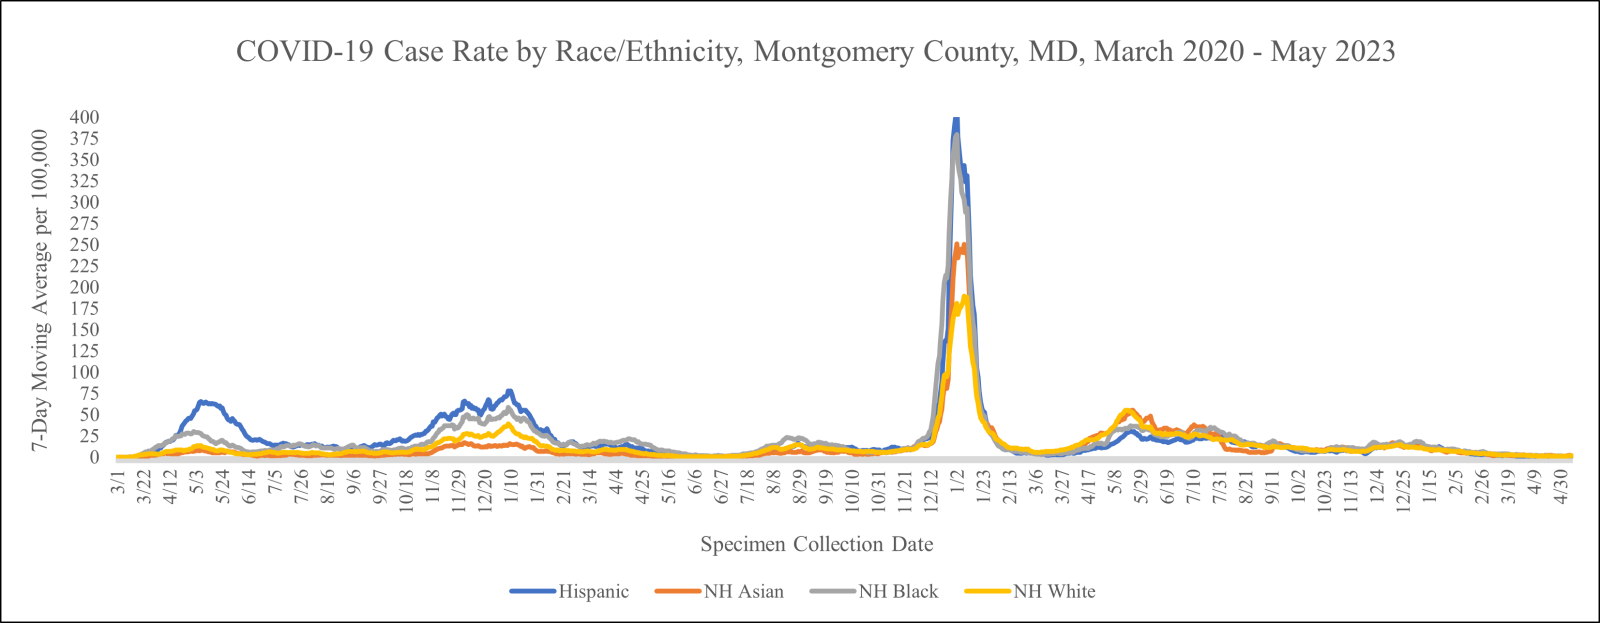
Case Rate by Race/Ethnicity over Time
Download data for Cases by Race/Ethnicity and Month (CSV)
Download data for Total Confirmed Cases by Race/Ethnicity (CSV)
Cases by ZIP Code
On August 5, 2021, the public-facing Montgomery County COVID-19 Dashboard methodology for monitoring COVID-19 related metrics was altered to align closer with the Centers for Disease Control and Prevention (CDC) Guidance released on July 27, 2021.
ZIP codes with less than 15 cumulative cases have been redacted from this report.
Open "Cases by ZIP Code" in a new window - view more easily on mobile devices!
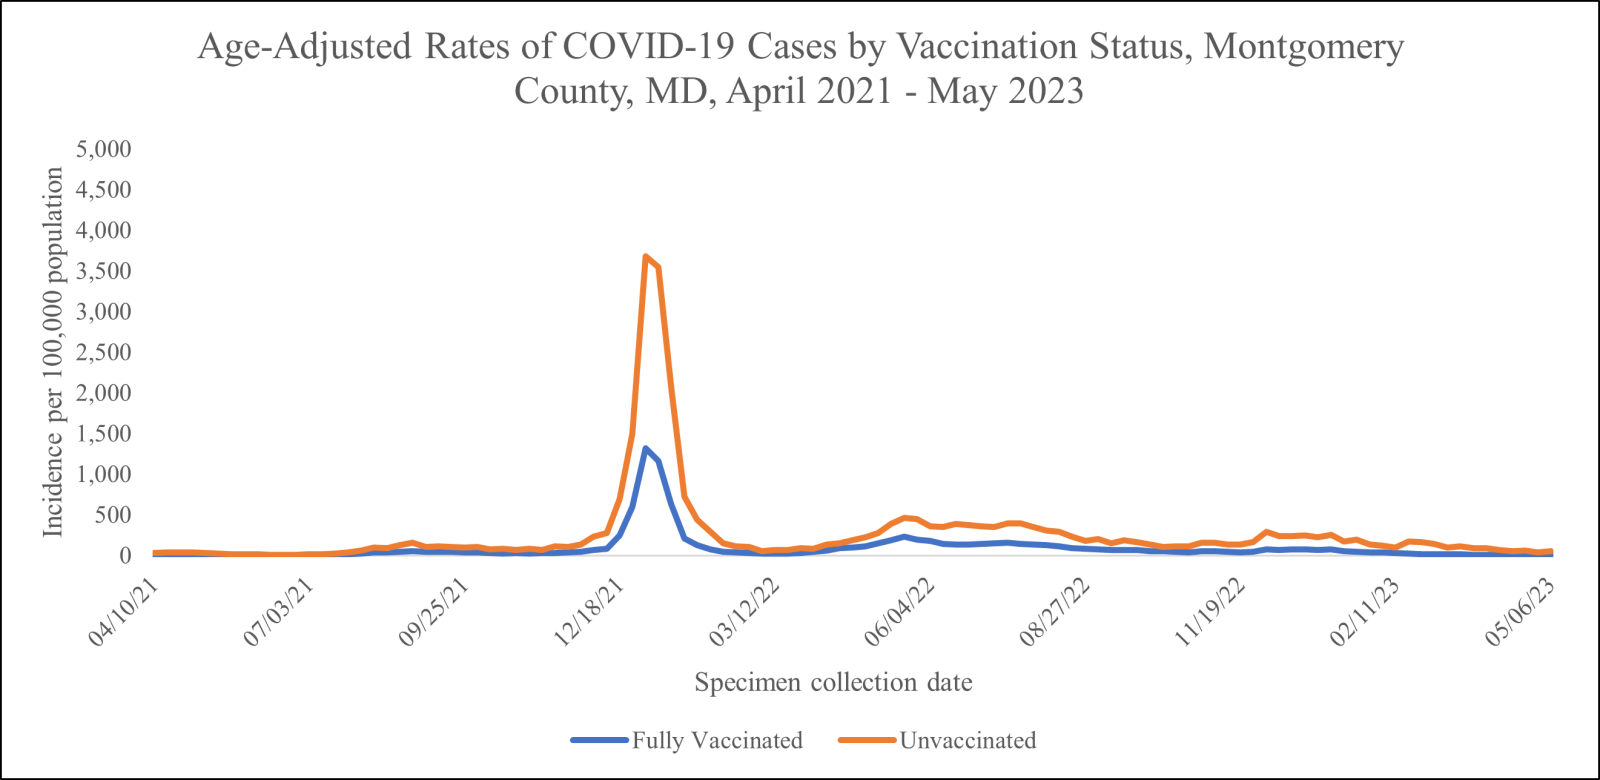
Cases by Vaccination Status
Download data for Age-Adjusted Rates of COVID-19 Cases by Vaccination Status (CSV)
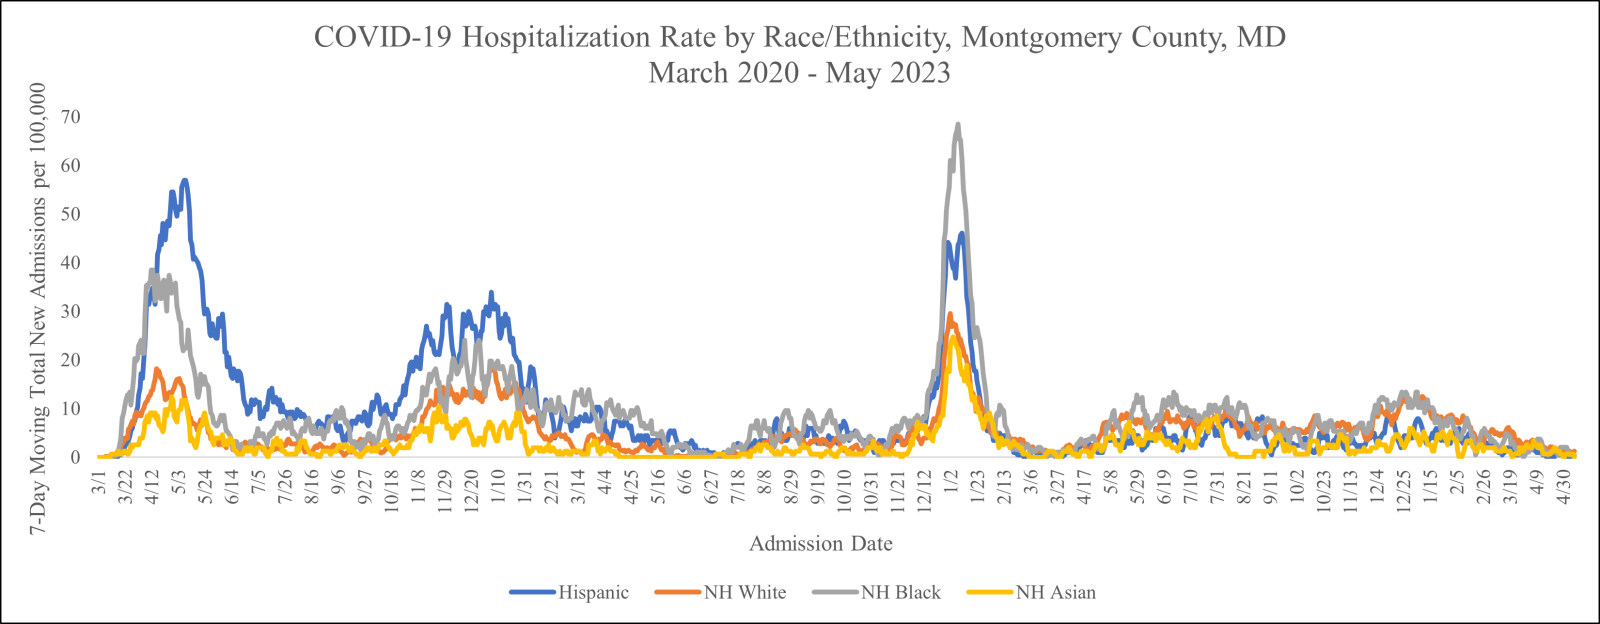
Hospitalizations by Race/Ethnicity over Time
Download data for COVID-19 Hospitalization Rate by Race/Ethnicity over Time (CSV)
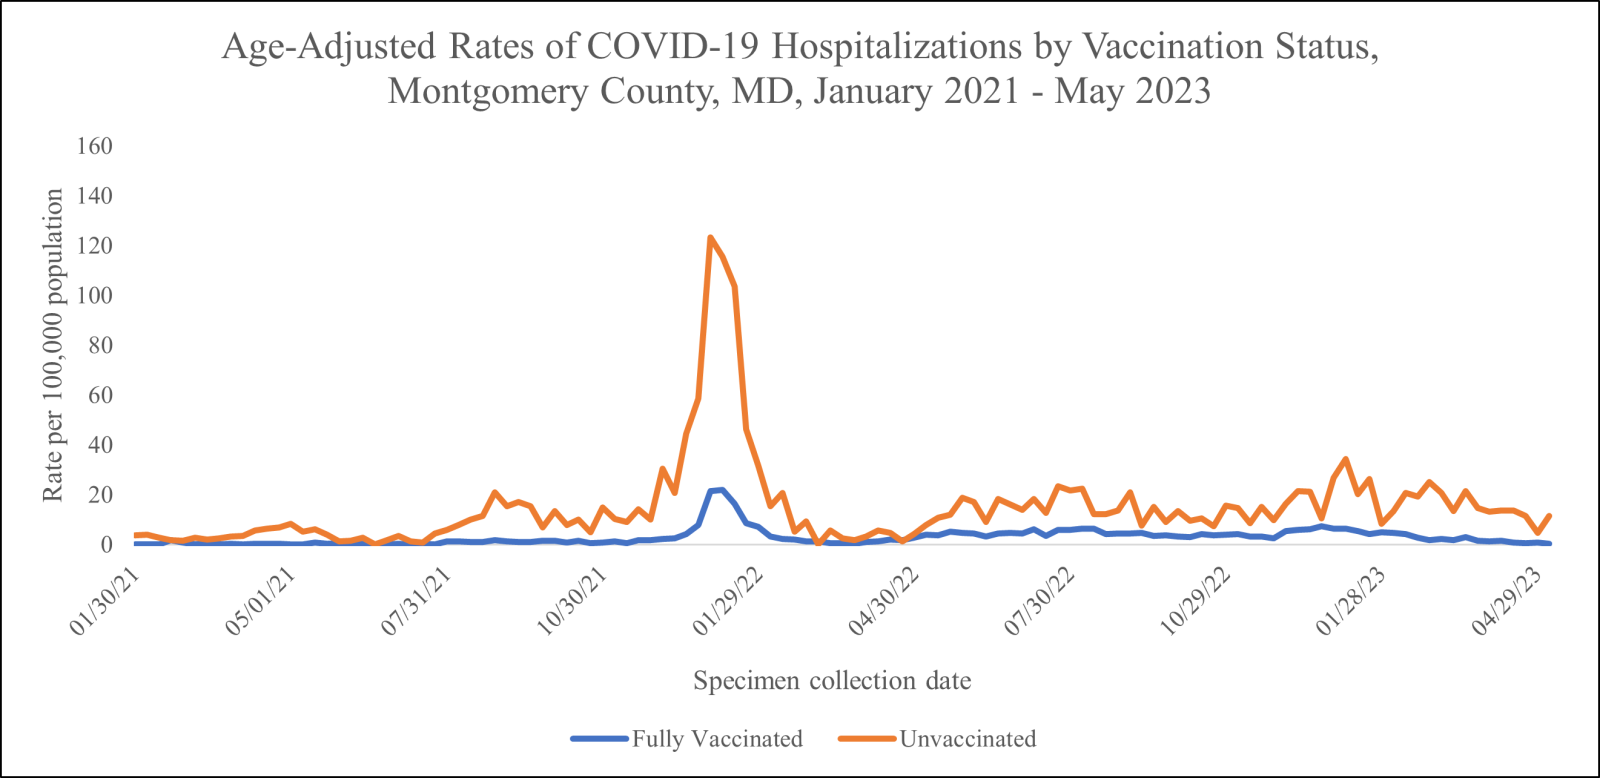
Hospitalizations by Vaccination Status
Download data for Age-Adjusted Rates of COVID-19 Hospitalizations by Vaccination Status (CSV)
| Age Group | Male | Female | Total | |||
|---|---|---|---|---|---|---|
| Count | Rate per 100K population | Count | Rate per 100K population | Count | Rate per 100K population | |
| 0-4 years | 1 | N/A*** | 0 | 0.0 | 1 | N/A*** |
| 5-17 years | 1 | N/A*** | 0 | 0.0 | 1 | N/A*** |
| 18-34 years | 13 | 12.2 | 7 | N/A*** | 20 | 9.4 |
| 35-64 years | 290 | 141.6 | 142 | 64.1 | 432 | 101.1 |
| 65+ years | 1,001 | 1,3672.2 | 902 | 938.6 | 1,903 | 1,125.7 |
| Total: all ages | 1,306 | 257.2 | 1,051 | 193.6 | 2,357 | 224.3 |
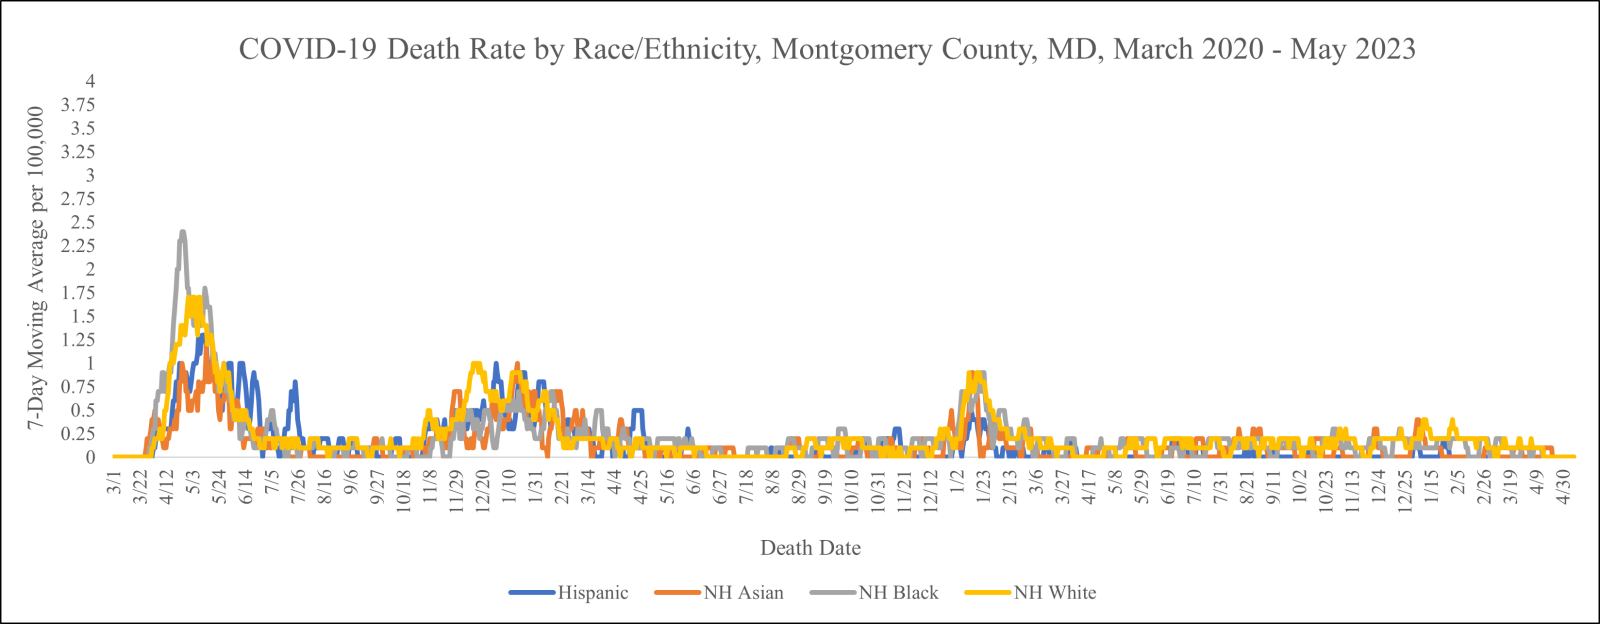
Deaths by Race/Ethnicity over Time
Row percent is displayed, representing the percentage of total deaths per month falling within each race/ethnicity group.
Download data for Deaths by Race/Ethnicity and Month (CSV)
Download data for Total Deaths by Race/Ethnicity (CSV)
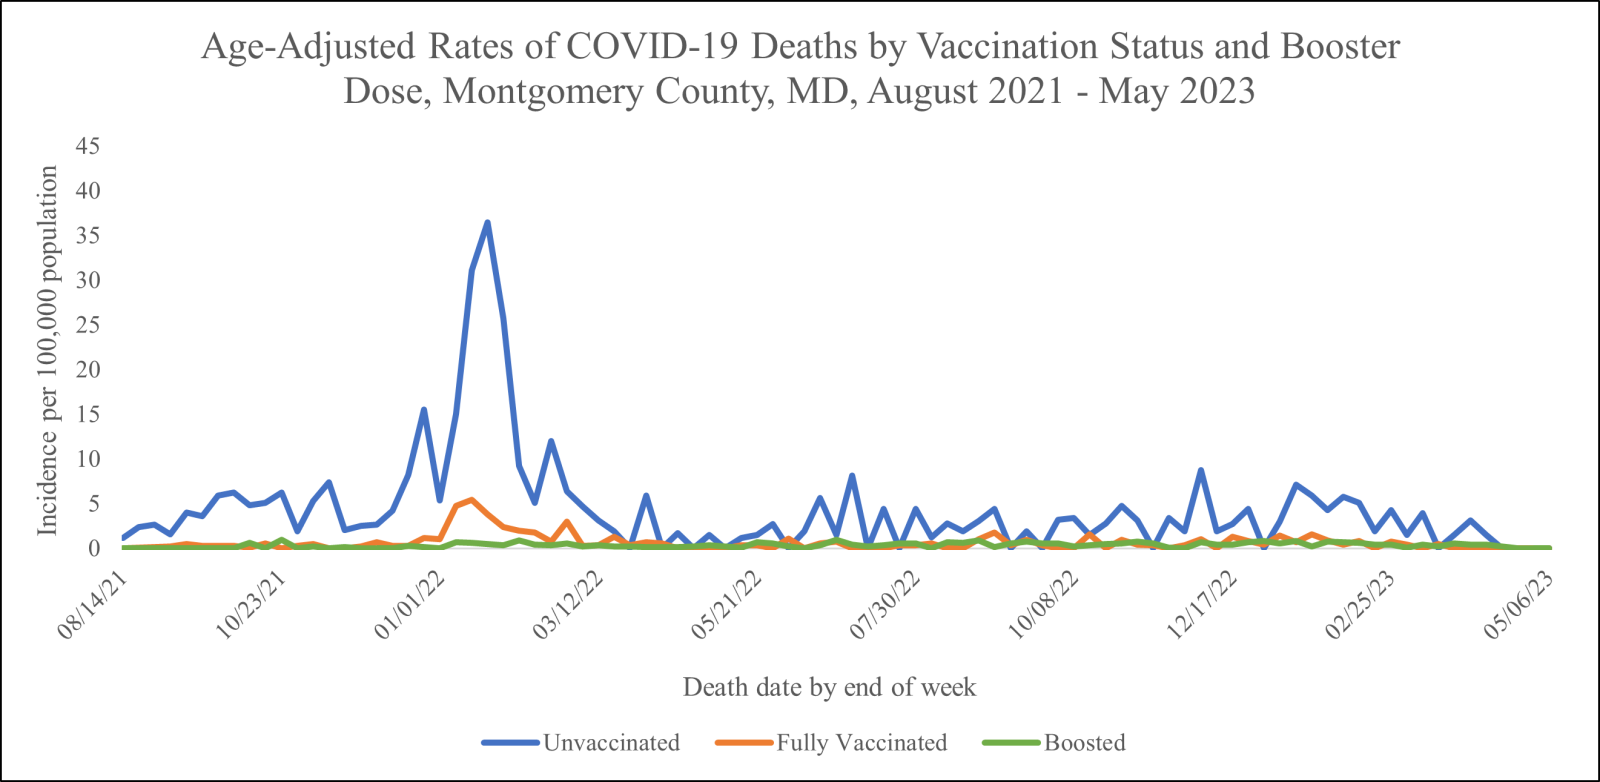
Deaths by Vaccination Status
Download data for Age-adjusted Rates of Deaths by Vaccination and Booster Dose (CSV)
Deaths by ZIP Code
Based on ZIP code of residence
Download data for Deaths by ZIP Code (CSV)
Open "Montgomery County Employee Cases" in a new window - view more easily on mobile devices!
Open "Montgomery County Employee Vaccination Status" in a new window - view more easily on mobile devices!